Back to Work
Interactive Graph Algorithm Visualizer
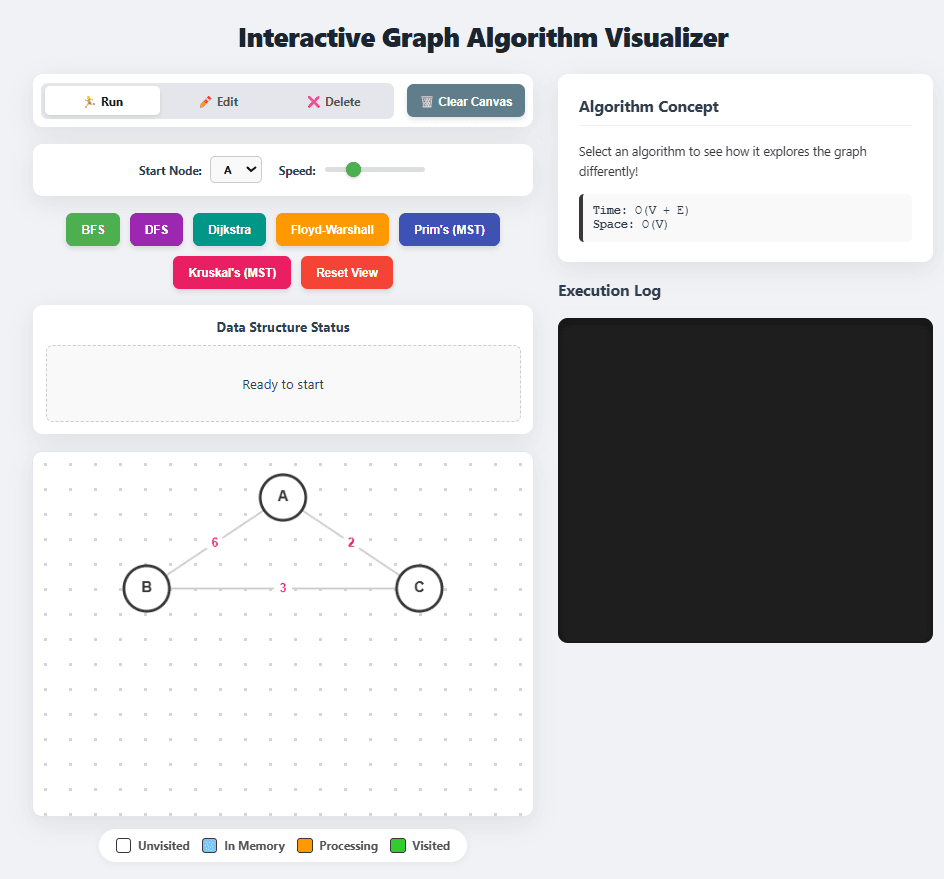
ShippedAn interactive visualizer for BFS, DFS, Dijkstra, Floyd-Warshall, Prim's, and Kruskal's algorithms with step-by-step frontier tracking and graph creation.
- HTML
- CSS
- JavaScript
- Canvas API
The Problem
Graph algorithms are taught as abstract procedures. You trace through BFS, DFS, and Dijkstra's on paper and memorize the steps. But I kept wondering what the algorithm was actually seeing at each step. What does the frontier look like to BFS as it expands? How does Dijkstra's perception of the graph change as it discovers shorter paths? I wanted to see the algorithm's state, not just its output.
What It Does
Architecture & How It's Built
Powered by HTML5 Canvas API and JavaScript data structures.
- Custom Adjacency Representation: Implements graph adjacency lists for dynamic node linking.
- Canvas Rendering Engine: Smooth 60fps canvas redraws with animated node pulses and path highlighting.
- Step Controller: Pause, play, step forward, and reset controls for algorithm debugging.
Decisions & Tradeoffs
- **The gap between understanding an algorithm and implementing it is wider than expected**: Writing a correct BFS is easy. Writing a visualization that faithfully shows what BFS is doing at each step forced a deeper understanding.
- **Stack vs Queue Dynamics**: Visualizing exploration step by step clarified why DFS uses a stack and BFS uses a queue as a natural consequence of traversal strategy.
- **HTML Canvas vs DOM Nodes**: Canvas API provided high-performance rendering for dense graph connections without DOM node inflation.
Roadmap & What's Next
- Adding A* Search algorithm visualization with customizable heuristic functions.
- Supporting graph import/export via JSON files.
Technology Stack
HTML
CSS
JavaScript
Canvas API
Quick Links
Started Last updated