Corporate business travel represents a substantial, tangible share of enterprise carbon emissions, yet organizations frequently treat it as unmeasured overhead or rely on generic annual averages. Without granular visibility into trip-level routes, cabin choices, and booking behaviors, sustainability teams struggle to pinpoint where emissions originate or evaluate the true impact of policy interventions.
Measuring carbon footprints at enterprise scale requires moving beyond static post-hoc spreadsheets to dynamic process analysis across tens of thousands of individual journeys.
The core objective: how do we leverage process mining and predictive modeling across real-world travel data to expose inefficiency and chart a viable, data-backed trajectory toward Net Zero?
This capstone analysis examines enterprise business travel operations through the lens of Celonis process mining and machine learning.
Across the dataset, the system:
- Process-Mines Travel Footprints: Ingests and analyzes over 65,000 corporate trip records to uncover patterns in journey routing, booking lead times, hotel stays, and policy compliance.
- Predicts Trip-Level Emissions: Trains a
RandomForestRegressor model to predict carbon emissions (CO₂e) on a per-journey basis, achieving an R² of 0.9991, a Mean Absolute Percentage Error (MAPE) of 3.02%, and a Mean Absolute Error (MAE) of 25.00 kg CO₂e.
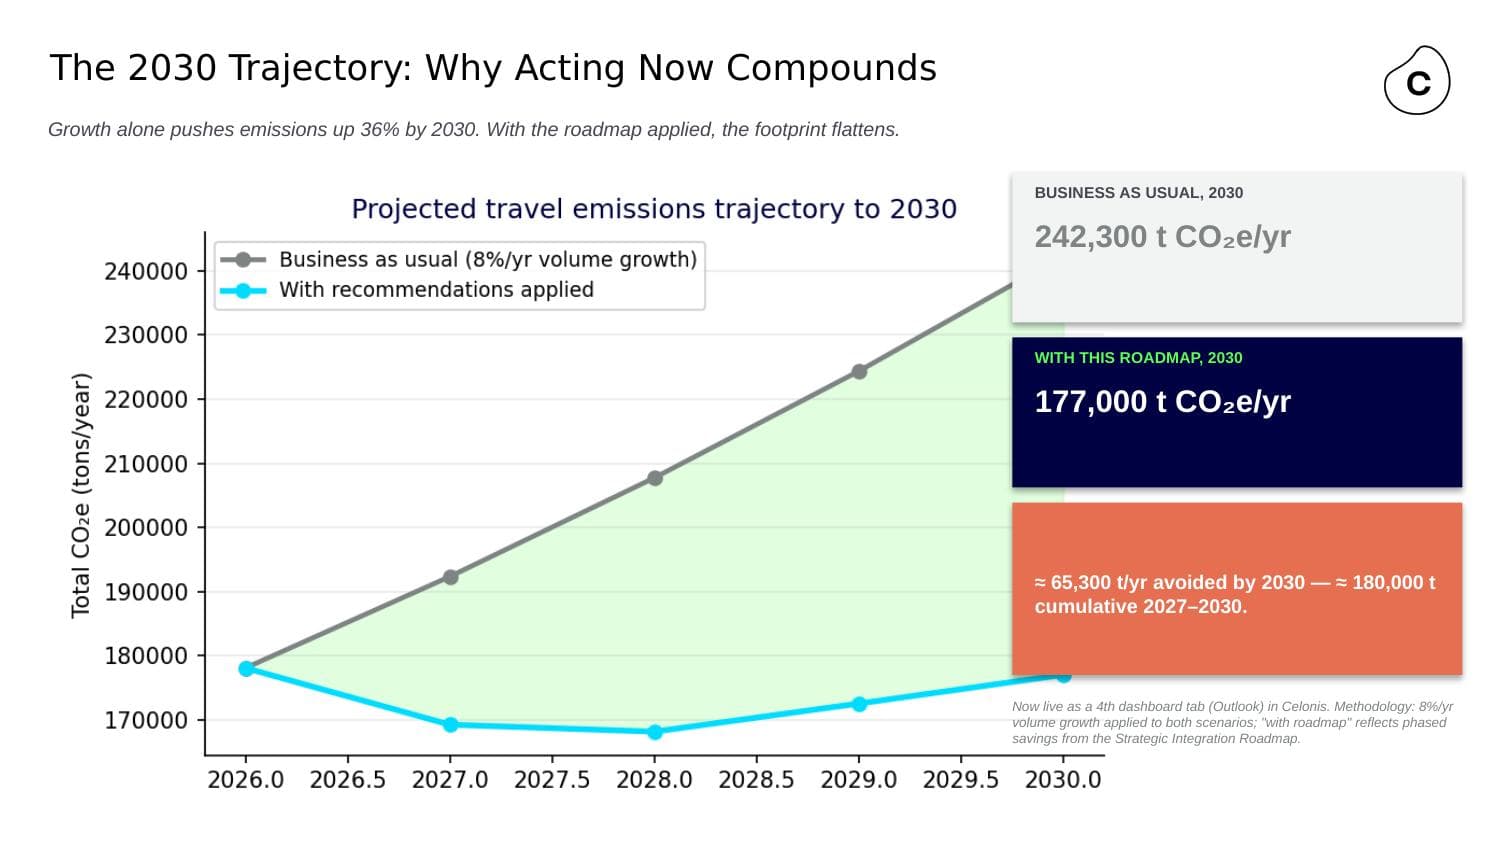
- Simulates Reduction Scenarios: Models concrete reduction pathways through 2030—evaluating the cumulative impact of shifting short-haul flights to rail, enforcing cabin class caps, eliminating out-of-policy bookings, and establishing departmental carbon budgets.
The pipeline combines process mining extraction with Python-based regression modeling using scikit-learn and pandas.
Feature Engineering & Modeling
The predictive model was trained on the verified enterprise feature set extracted from the booking logs:
- Location Attributes:
DepartureLocationCountry, DepartureLocationCity, ArrivalLocationCountry, ArrivalLocationCity
- Transport & Service Details:
ShippingType, ShippingTypeDescription
- Trip Metadata & Policy:
Purpose, OutOfPolicy, BusinessUnit
- Cost & Duration Variables:
HotelNights, NetCosts
The dataset was partitioned into an 80/20 train-test split (test_size=0.2, random_state=42), allowing robust evaluation against unseen journey configurations.
Feature Importance & Route Sensitivity
Tree-based feature importance analysis revealed that route geometry and travel class dominate predictive behavior:
ArrivalLocationCountry: 36% importanceShippingTypeDescription: 23% importanceDepartureLocationCountry: 17% importance
Together, origin-destination country pairs and transport modality account for 95%+ of the model's predictive power, confirming that high-level routing and flight class drive the vast majority of trip-level variance.
Scale & Internal Consistency
When applied to 21,764 private corporate trips, the model predicted ≈58,690 tons CO₂e in total emissions and flagged 25.1% of journeys as high-carbon. This matches the public dataset's 25.0% baseline high-carbon rate almost exactly—a critical internal consistency check verifying model generalization across disparate booking batches.